
Episode 1 – April 29th
ICT like to build his idea of bias before sunday opening.
1 – Looks where we are in term of seasonal tendency. ( Steeve More as resource)
Look multiview overlay where you can compare for example the 15y with a longer sample set. Look
where there is 2 sample set of time are moving along ( ex: 15y and 30y) . Like to trade in correlation with this seasonal tendency.
ICT picks the very sweets spot for trading. Emphasis is to look for market you trade.
Spring high tends to be muddy, and late may early june we rally up.
Very easy long position in September OCtober and 2 weeks of November is easy ( min 20:00)
when market structure and seasonal tendency are aligning you feel very confident.
2 – Economic calendar ( forexfactory.com or https://www.econoday.com)
many time during the time of red folder release is time for the manipulation.
Need to look what price did before this economic news release. There is SM that know already what the news is gonna be long before news release.
Anticipate that economic report to be a juda’s swing ⇒ reache an FVG or pool of liquidity ( High or low depending if we bearish or bullish)
ex : IF bearish, i wanna see right before 8:30 a run lower to induce early sellers and cut all buyers.
Then , at 8:30 a rally up to get out early sellers.
ICT like to trade on Monday on NFP weeks even if there no news.
Help filters out and select best days. Being a daytrader doesn’t means to look for a trade every day !!!
When to avoid daily bias ?
When week calendar is a minefield aka full with red folder news. In that condition it’s either:
- you don’t trade
- you trade with no bias aka trade intraday volatility.
Without a bias, you lower your risk.
3- Analysis of US Dollar Index.
With all the even of the world ( war ukraine – Israel- africa) ICT expect that DXY to rise. That doesn’t mean Indicies gonna fall right away. They can move in tamdem for a time. ( Note= that’s what is happening currently ( May – June 2024).
Start with the monthly chart ( analysis is same on all TF) :
Where are we now ? Where does price is coming from and how ?
When there is no economic calendar event I rely on the macro, What are the one that cause Intermediate change in MSS are:
- 9:50 – 10:10
- 10:50 – 11:10
- 13:50 – 14:10
- 14:50 – 15:10
There are others but these ones are more important.
What to do with economic driver at 10:00 and all market structure , seasonal tendency is in your favor. = > turtle soup when even takes liquidity pool.
Then ICT says it would add to every pd array until 40% of anticipated move is done.
ICT explains how He formulates his bias, from daily bias to session bias. Relatively to economic calendar, he ssays that it’s better , during this particular week, to go for low hanging fruit, scalping and or intraday trading. I think he tries to explain daily bias and when to not care too much about it.
I did not take notes about daily bias as I already have plenty in that page .
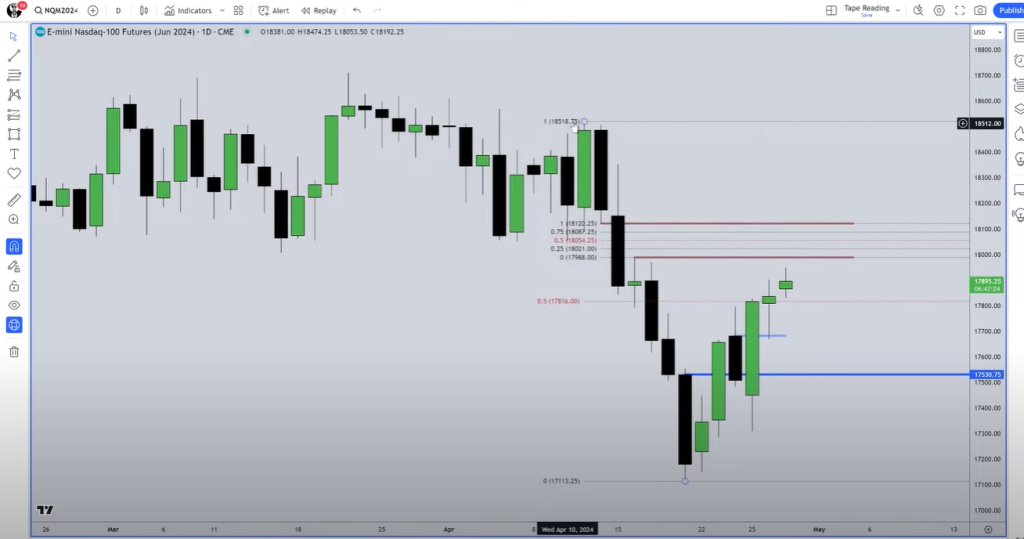
In the chart above we expect that NQ go higher.
The large blue line is ths Change In State of Delivery ( CISD) . When you have no bias you expect that this level to act as a trampolin. In the Lower time frame if you see a FVG at this level, you can use it to frame a long and got 10 to 20 handles and be done.⇒ that’s trading without a bias.
The second black candle is crucial bcz it’s discount. it’ an OB. When we arrive at 50% of the range, Orderblocks can be 50/50.
Session Bias:
Drop to H4 chart with your daily levels noted. You only need to mark 4, 3 or 2 levels not more. Becaust you’re daily with daily levels.
In an Up move you wanna see few down close candle when price is going up. If you lots of down close candle it means that youre Consolidation 50% of that move OR youre reaching the end of the move.
Down close candles should only be there for new Buy opportunities.
M, W, Daily even H4 levels must be on your charts
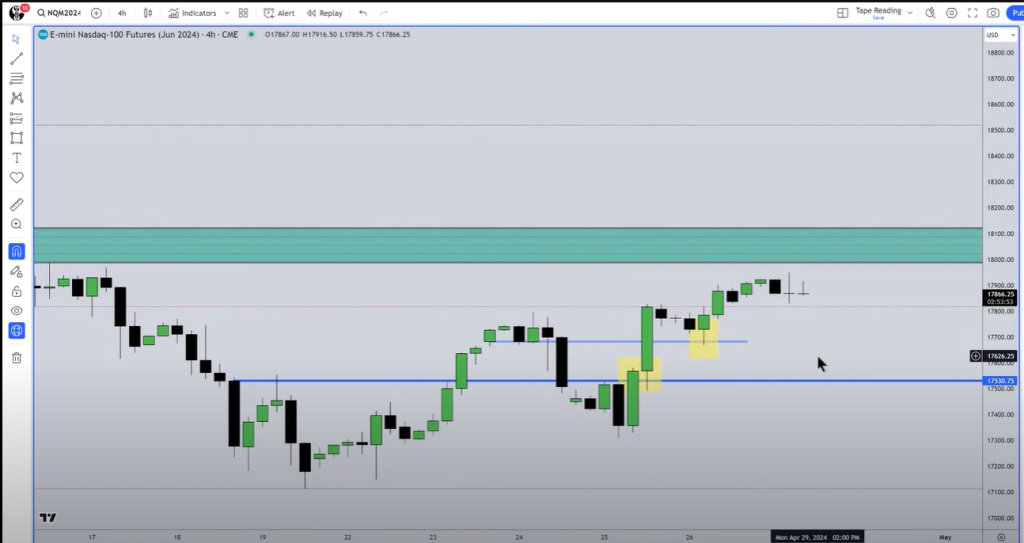
Yellow boxes are here for study purposes when we go to lower tf
Immediate rebalance :
When the market has a nice big bullish run candle higher and the immediate candle after come back on the or the body of previous candle. When price does this we looking if price is going our way.
If price does not, it’s not a good sign and capital should be preserved.
Immediate rebalance is very strong
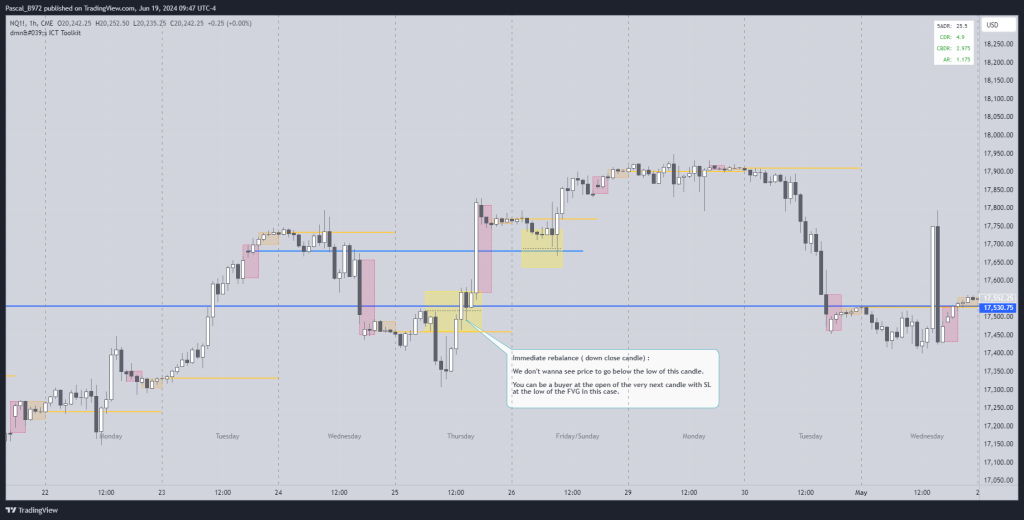

if price closes every gap down while going up, it’s probably a sign of the move slowering.
NWOG, even of 1 tick , will be refered many tie during the week. same thing with NDOG.
If you place you SL inside NWOG/NDOG it’s gonna be triggereed. ( I imagine its good to place a TP there)
Look at everything. On price action he looks how fvg have been filled, completly or partially.
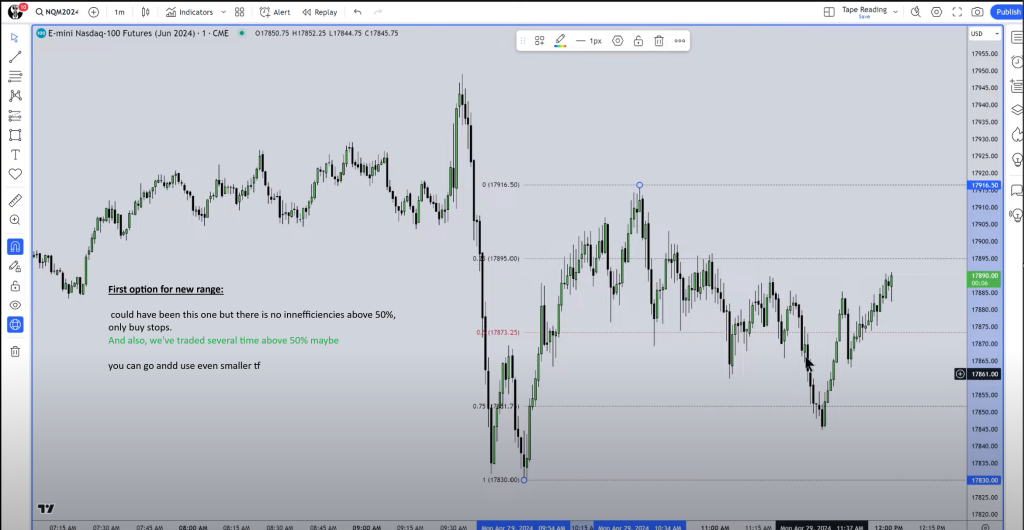
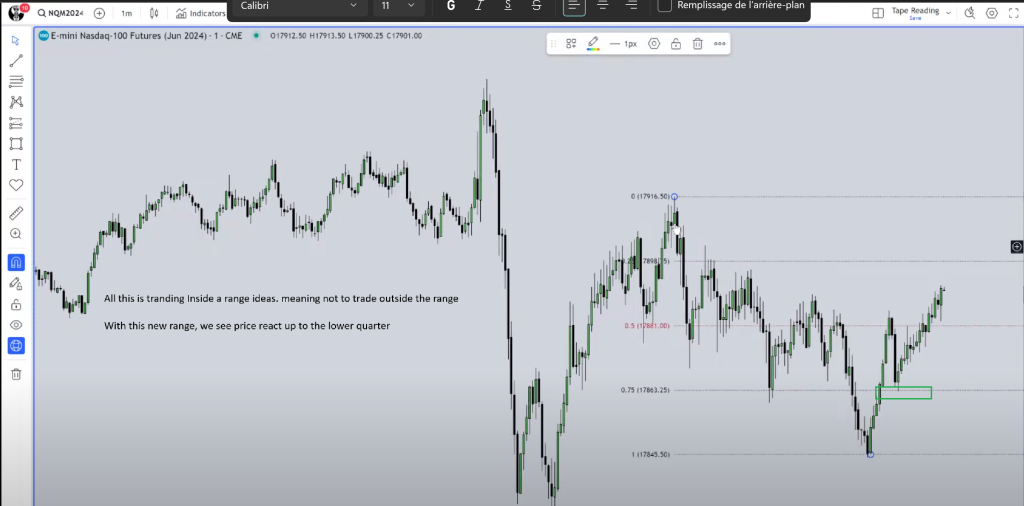
Ranges:
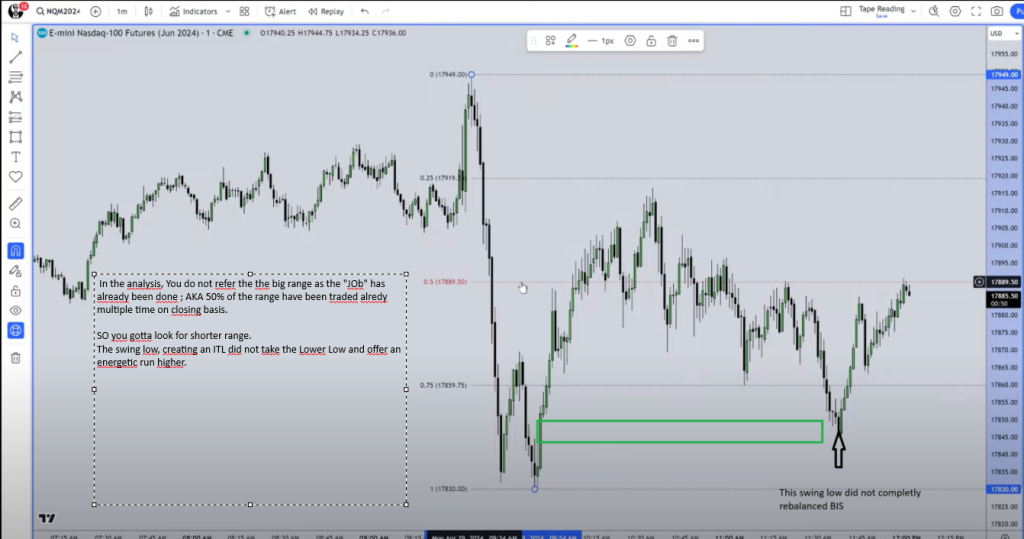
Episode 2 – April 30th
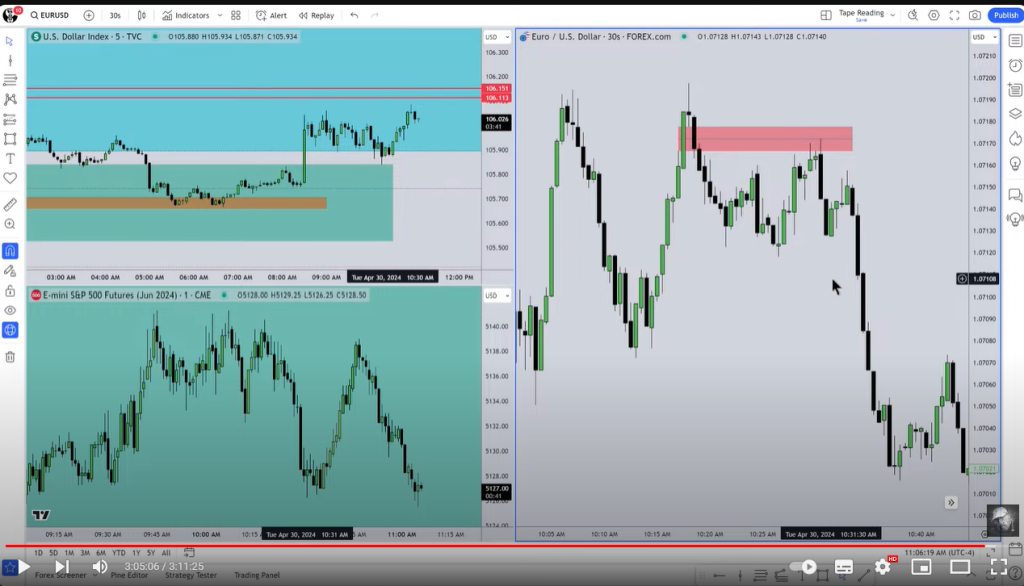
First Part – Related to Forex but can be use also for Indicies.
The dealing range is when both side of the liquidity is taken.
Reversal pattern, you wanna use a correlated asset.
Start is a recap of a lot of thing I know already.
Without a bias, you go with surgical strike. In & Out. You don’t wann go for the lowest low or Highest high.
On NFP week, have all your trading done by 11:00 AM wednesday.
NFP day & The Thursday before are the less probable trading day.
15min after NFP numbers are release, you can trade again.
Second Part – Indicies Focus
wherever you have a range encapsulated by two wicks, you wanna get measurement of both candle to mark the implied FVG.
Most of this par is tape reading NQ .
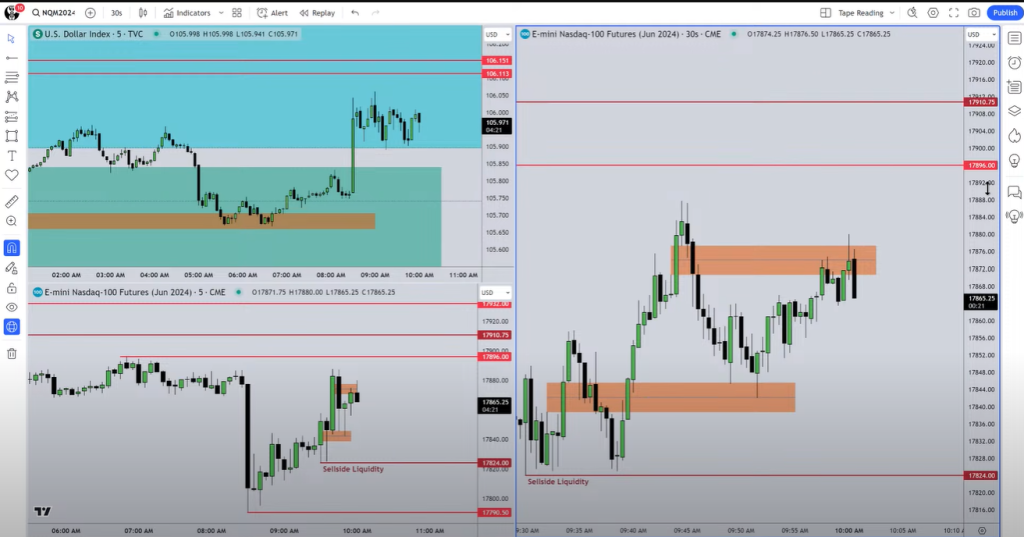
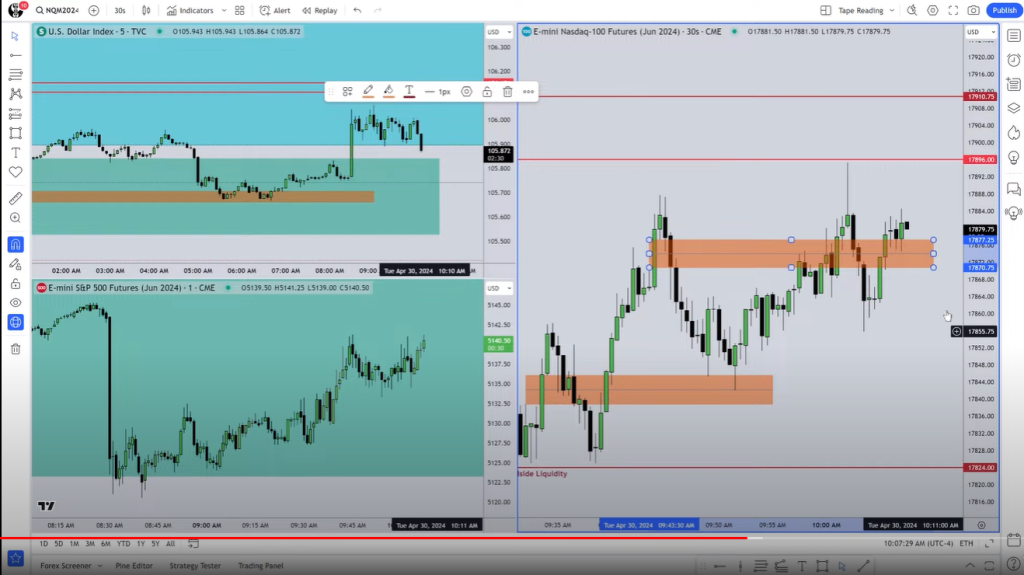
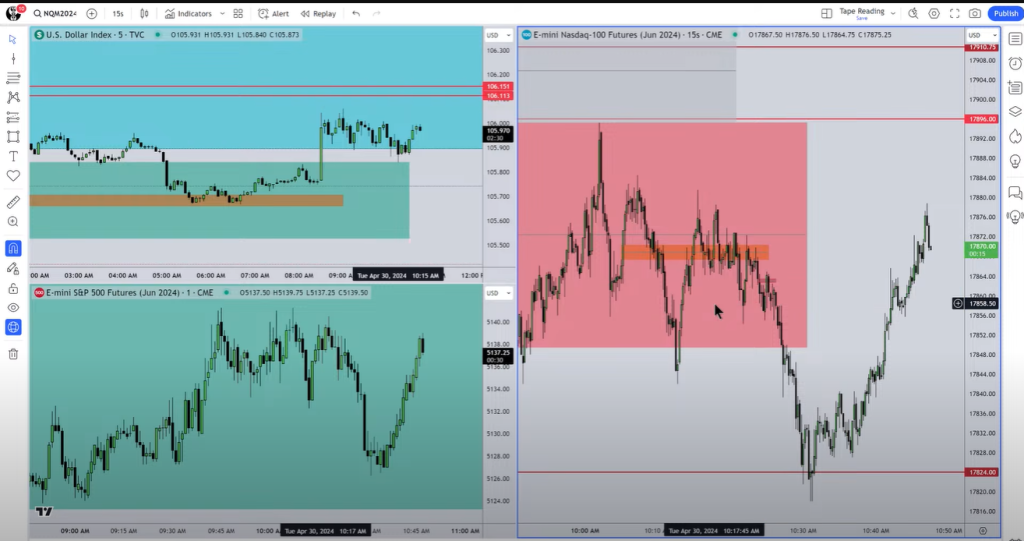
In the exemple below ICT doesn’t really know if price gonna go up or down 1st. He’s annotated all proximal liquidity and how price is reacting to FVGs. He alos compares live how dxy is beahaving, which Swing Highs or Lows is taken.
At this moment ( 10:00:39) no setup.
Since the openning bell, Longs holder are in the moment aka in profit. ICT preferes to wait for a 10 O’clock silver bullet
The inversion did not send price lower. Price went below then above. It’s now a reclaimed fvg.
Note that Ict keeps it on his chart.
There are big news on the next day, so the only price action you should anticipate is price going to take stop and come back into the range again and again. we’re in the middle of the range, price can go anywhere. trading here is a gamble. We’re not gamblers.
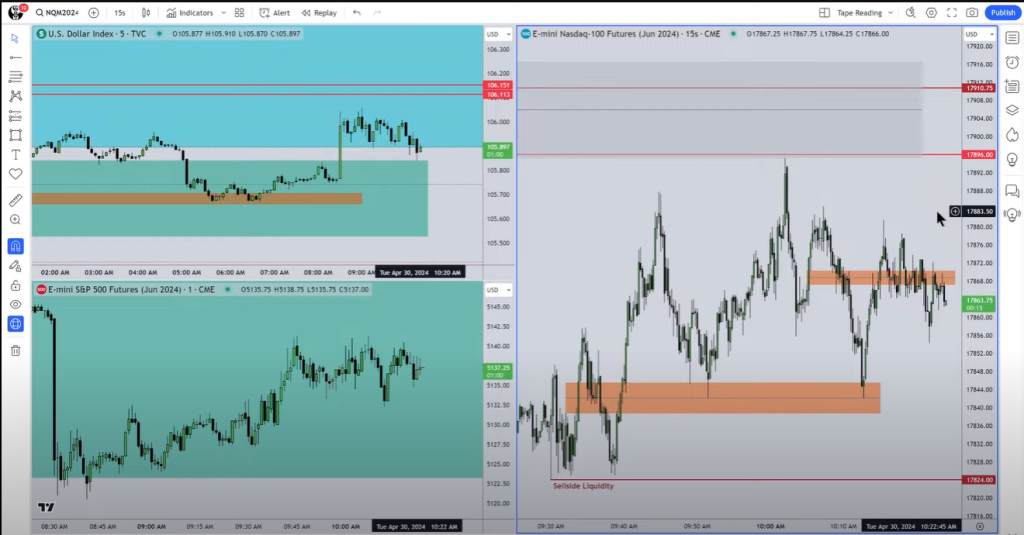
Good exemple of waiting when price is testing and retesting this inversion fvg.
2:22:47
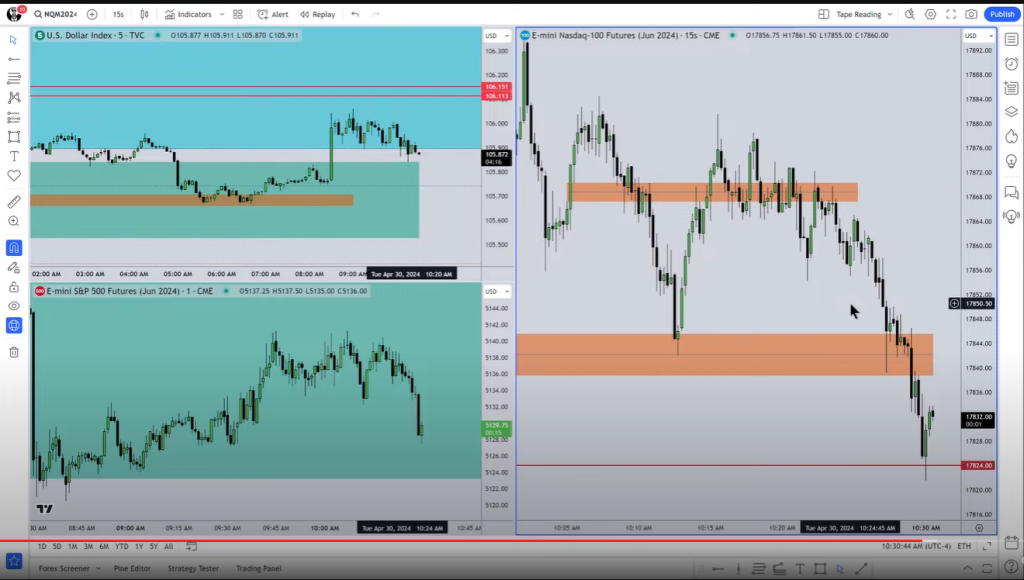
In this particular hard condition, you forge your mental. You have to wait longer for market to tip its hand.
Above chart can show how price had difficulties to pass the inversion, jagged higher but never managed. then sell off.
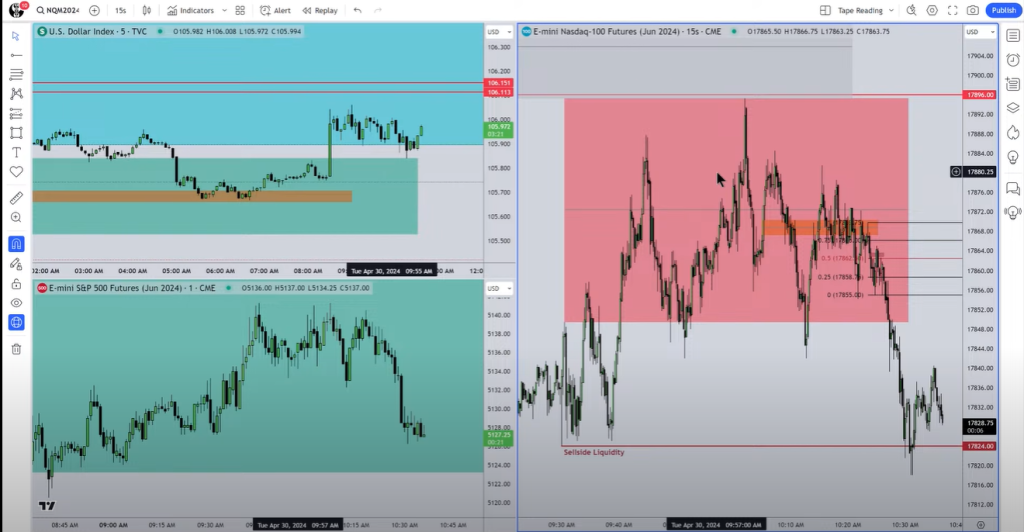
Initially ICT wanted to see BSL at 17896 taken first but PA showed that it’s doesn’t want to go higher. SO He had to revise his opinion on SLL at 17824 getting taken first.
Your bias intra session can evolve when daily bias is not “available”.
Volume preceed price ( 2:35:00): For example in the commodity market you can see ( real ) volume decreasing and price ralling higher. The volume is preceeding price. this is telling that there is no more contract s traded in the upside of the chart. Volume declines when ther is heavy distribution. Most of the time it’s like that.
Majority of the volume at the open is during first 30 minutes ( Opening range). Most of time ICT waits for this 30 minutes to be passed. If price failed to reach a certain level ( premium level or gap ) , what does it tell ?? It means it couldn’t even get there ⇒ market is weak so it will either stagnat are fall.
After SSl Taken, price rallied higher.
Balance price range ( 2:59:45) :
A BPR is when you a 2 inefficiencies in opposing direction in the same area. It is a fvg that can be view both way.
Important: Don’t feel the rush, to force a trade. When you don’t know what to do you just wait more.
Episode 3 – May 1st : Key Notes & Observations
When DXy is uncertain, and the week a mine field in term of News event , you can’t go with a daily bias. You must go with a intraday/session bias based on intraday/session liquidity.
Having your hand itching aka feeling the urge, the “necessity” to get in a trade needs to be addressed. That’s a type of behaviour that blows accounts. Increasing normal size before entering a trade bcz “it’s moving really good” need to be addressed also. This is not a professionnal mindset.
Important is to stick to your rules = your edge. Even more in market conditions like that where price takes BSL & SSL constently.
FOMC: News event that is a 2 stages delivery (also NFP) .
- whatever happens from 2:00 going to 2:20 – 2:35 is usually the fake move ( very most often).
- AFter, it goes in the other direction.
This type of event is also when can happens a manual intervention, meaning that THEY can drive the price where they want in a very quick and brutal manner.
ICT trades FOMC betweent 2:30 and 3:15. If you wanna trade on FOMC you MUST wait at least for 2:30.
When can we anticipate that price is gonna move beautifully , looking for LRLR ? It’s when the economic calendar has 1 or 2 High or medium news impact .
When you can see aa clear entry, and it so clear and there is a evident inefficiency where you see price is gonna to; it’s the very moment when you can engage price. Otherwise you wait.
You use the H4-H1 chart to formulate your session bias. That’s gonna give you the bias for the session. When You engage and you lose, you stop. Learn how to end the day with a loss AND comeback the next and follow your model. Thats strengh.
Gems 💎: You don’t wanna see a gap completly fully closed. This is telling you where price wants to go. If a Sibi is not filled completly, that’s a sign price is really bearish.
GAP = FVG = RTH Gap = Void = Bisi = Sibi
Regarding RTH Gap we always expect that price will close at leasat 50% of the range.
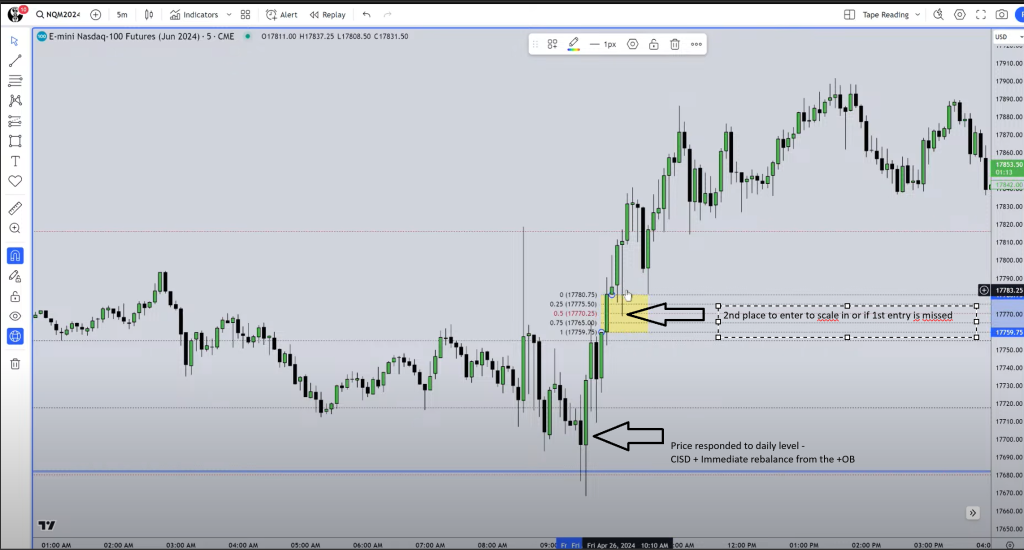
IOFED; Institutional Order Flow Entry Drill:
When an FVG formed and the position where it form you can expect an IOFED ( = not traded to CE)
The way to be in sync is to use the low of the candle ( high of fvg) and low of the Candle as SL.
2:48:00